Purpose:
Gain experience using a Graph on real life data. Learn about network communication and how to analyze network traces using a Library. Gain experience using the graph algorithms for connected components and minimum spanning tree.
Story: You are the NSA and are responsible with knowing what everyone is talking about. You are faced with budget restrictions and need to minimize the number of computers to infiltrate. You have access to metadata about all communication so you can build a graph of what machines are talking to each other. With this you can create a list of target computers that you want to gain access to. You have access to the spanning port on various routers and have packet capture (PCAP) dump files of traffic.
1. Read in a packet trace provided using the pcap4j library and build a graph based on the communication using GraphStream. A node represents each IP address. Each edge is created as the result of a bidirectional communication between two nodes (One way only is ignored).The edge weight is based on the number of packets between those nodes. Use the attribute name “weight” on the edge to store the weight value. If a node does not have an edge then do not add it to the graph. You can use a HashMap to keep track of what communications exist for the first pass over the data. Then you can read the packets again and lookup in the HashMap if the edges exist both ways before you add or increment the edge in the graph.
Read in multiple network traces (PCAP files) and find one that gives you multiple connected components. Although you can limit the number of packets read to a low value for testing, the version you turn in should read in all packets.
2. Find the connected components of the graph using BFS or DFS. Do not use the GraphStream algorithm for this, write it yourself.
3. For each connected component compute the Maximum Spanning Tree using Prim or Kruskal’s algorithm and negating the weights. This will give you a tree with a new degree for each node. Use the Java PriorityQueue for this (You can just remove and add elements to update them) and implement Prim or Kruskal’s algorithm yourself.
4. Print out the top 3 nodes in each connected component ordered by the degree of each node. Also order the connected components in descending order.
CC:0, 45 Nodes Total
=Without Maximum Spanning Tree:
  172.16.117.132,58
  209.1.28.222,2
  204.202.134.10,2
=With Maximum Spanning Tree:
  172.16.117.132,5
  209.1.28.222,2
  204.202.134.10,1
CC:1, 23 Nodes Total
=Without Maximum Spanning Tree:
  172.16.112.50,11
  194.7.248.153,3
  199.172.144.25,2
=With Maximum Spanning Tree:
  194.7.248.153,3
  172.16.112.50,1
  199.172.144.25,1
Data
Download the inside or outside tcpdump PCAP files from the 1999 DARPA intrusion detection evaluation dataset website. The file extension is .tcpdump but they are PCAP files.
Download the snort log PCAP files from SPARSA Information Security Talent Search dataset website. The file extensions are not .pcap but they are PCAP files.
Make your own PCAP file using your network card:
$sudo tcpdump -w mycap.pcap
Libraries and Code Examples
To read PCAP files we will use the pcap4j Java library. This library also allows for live captures from a network card. We will only be using it to decode IPv4 packets from PCAP files. (Note: If you are using Windows then you must install WinPcap for this library to work)
To build a graph and visualize it we will use the GraphStream library. This library makes it easy to model data because nodes and edges are identified by strings so maintaining references to nodes are not required. It uses OpenGL to visualize graphs in an animated way.
You can find the jar files for these libraries as well as sample code and scripts to run your program from the command line here: https://github.com/ieee8023/cs310-summer2016
The scripts “compile.sh”, “getclasspath.sh”, and “run.sh” are used to run your code on the command line. Edit run.sh to point to Class with the main method you want to run.
Sample Input/Output Benchmark
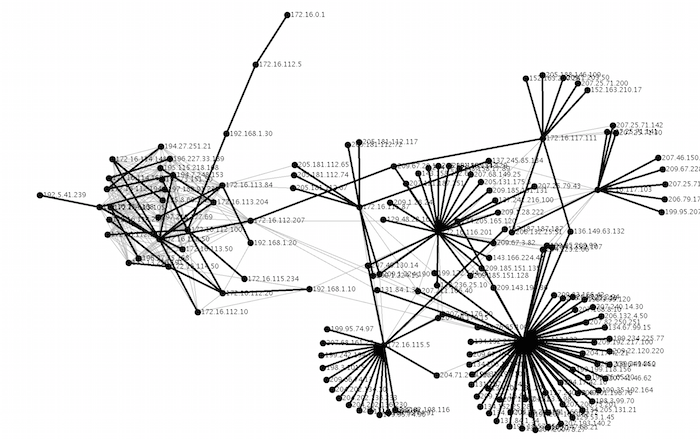
Here is a close up of the largest connected component with it’s maximum spanning tree colored in blue.

The output for the sample file (outside.tcpdump-small) provided on github should be:
$sh run.sh outside.tcpdump-small
CC:0, 23 Nodes Total
=Without Maximum Spanning Tree:
  135.8.60.182,13
  172.16.113.105,6
  194.7.248.153,4
=With Maximum Spanning Tree (Weight:2068):
  135.8.60.182,13
  172.16.114.207,4
  172.16.113.105,3
CC:1, 5 Nodes Total
=Without Maximum Spanning Tree:
  192.168.1.10,4
  172.16.112.20,1
  192.168.1.20,1
=With Maximum Spanning Tree (Weight:158):
  192.168.1.10,4
  172.16.112.20,1
  192.168.1.20,1
outside.tcpdump (Monday)
Here is the output for the file (1999 DARPA intrusion detection evaluation outside.tcpdump from Monday). Here is a close up of the largest connected component with it’s maximum spanning tree colored in blue.
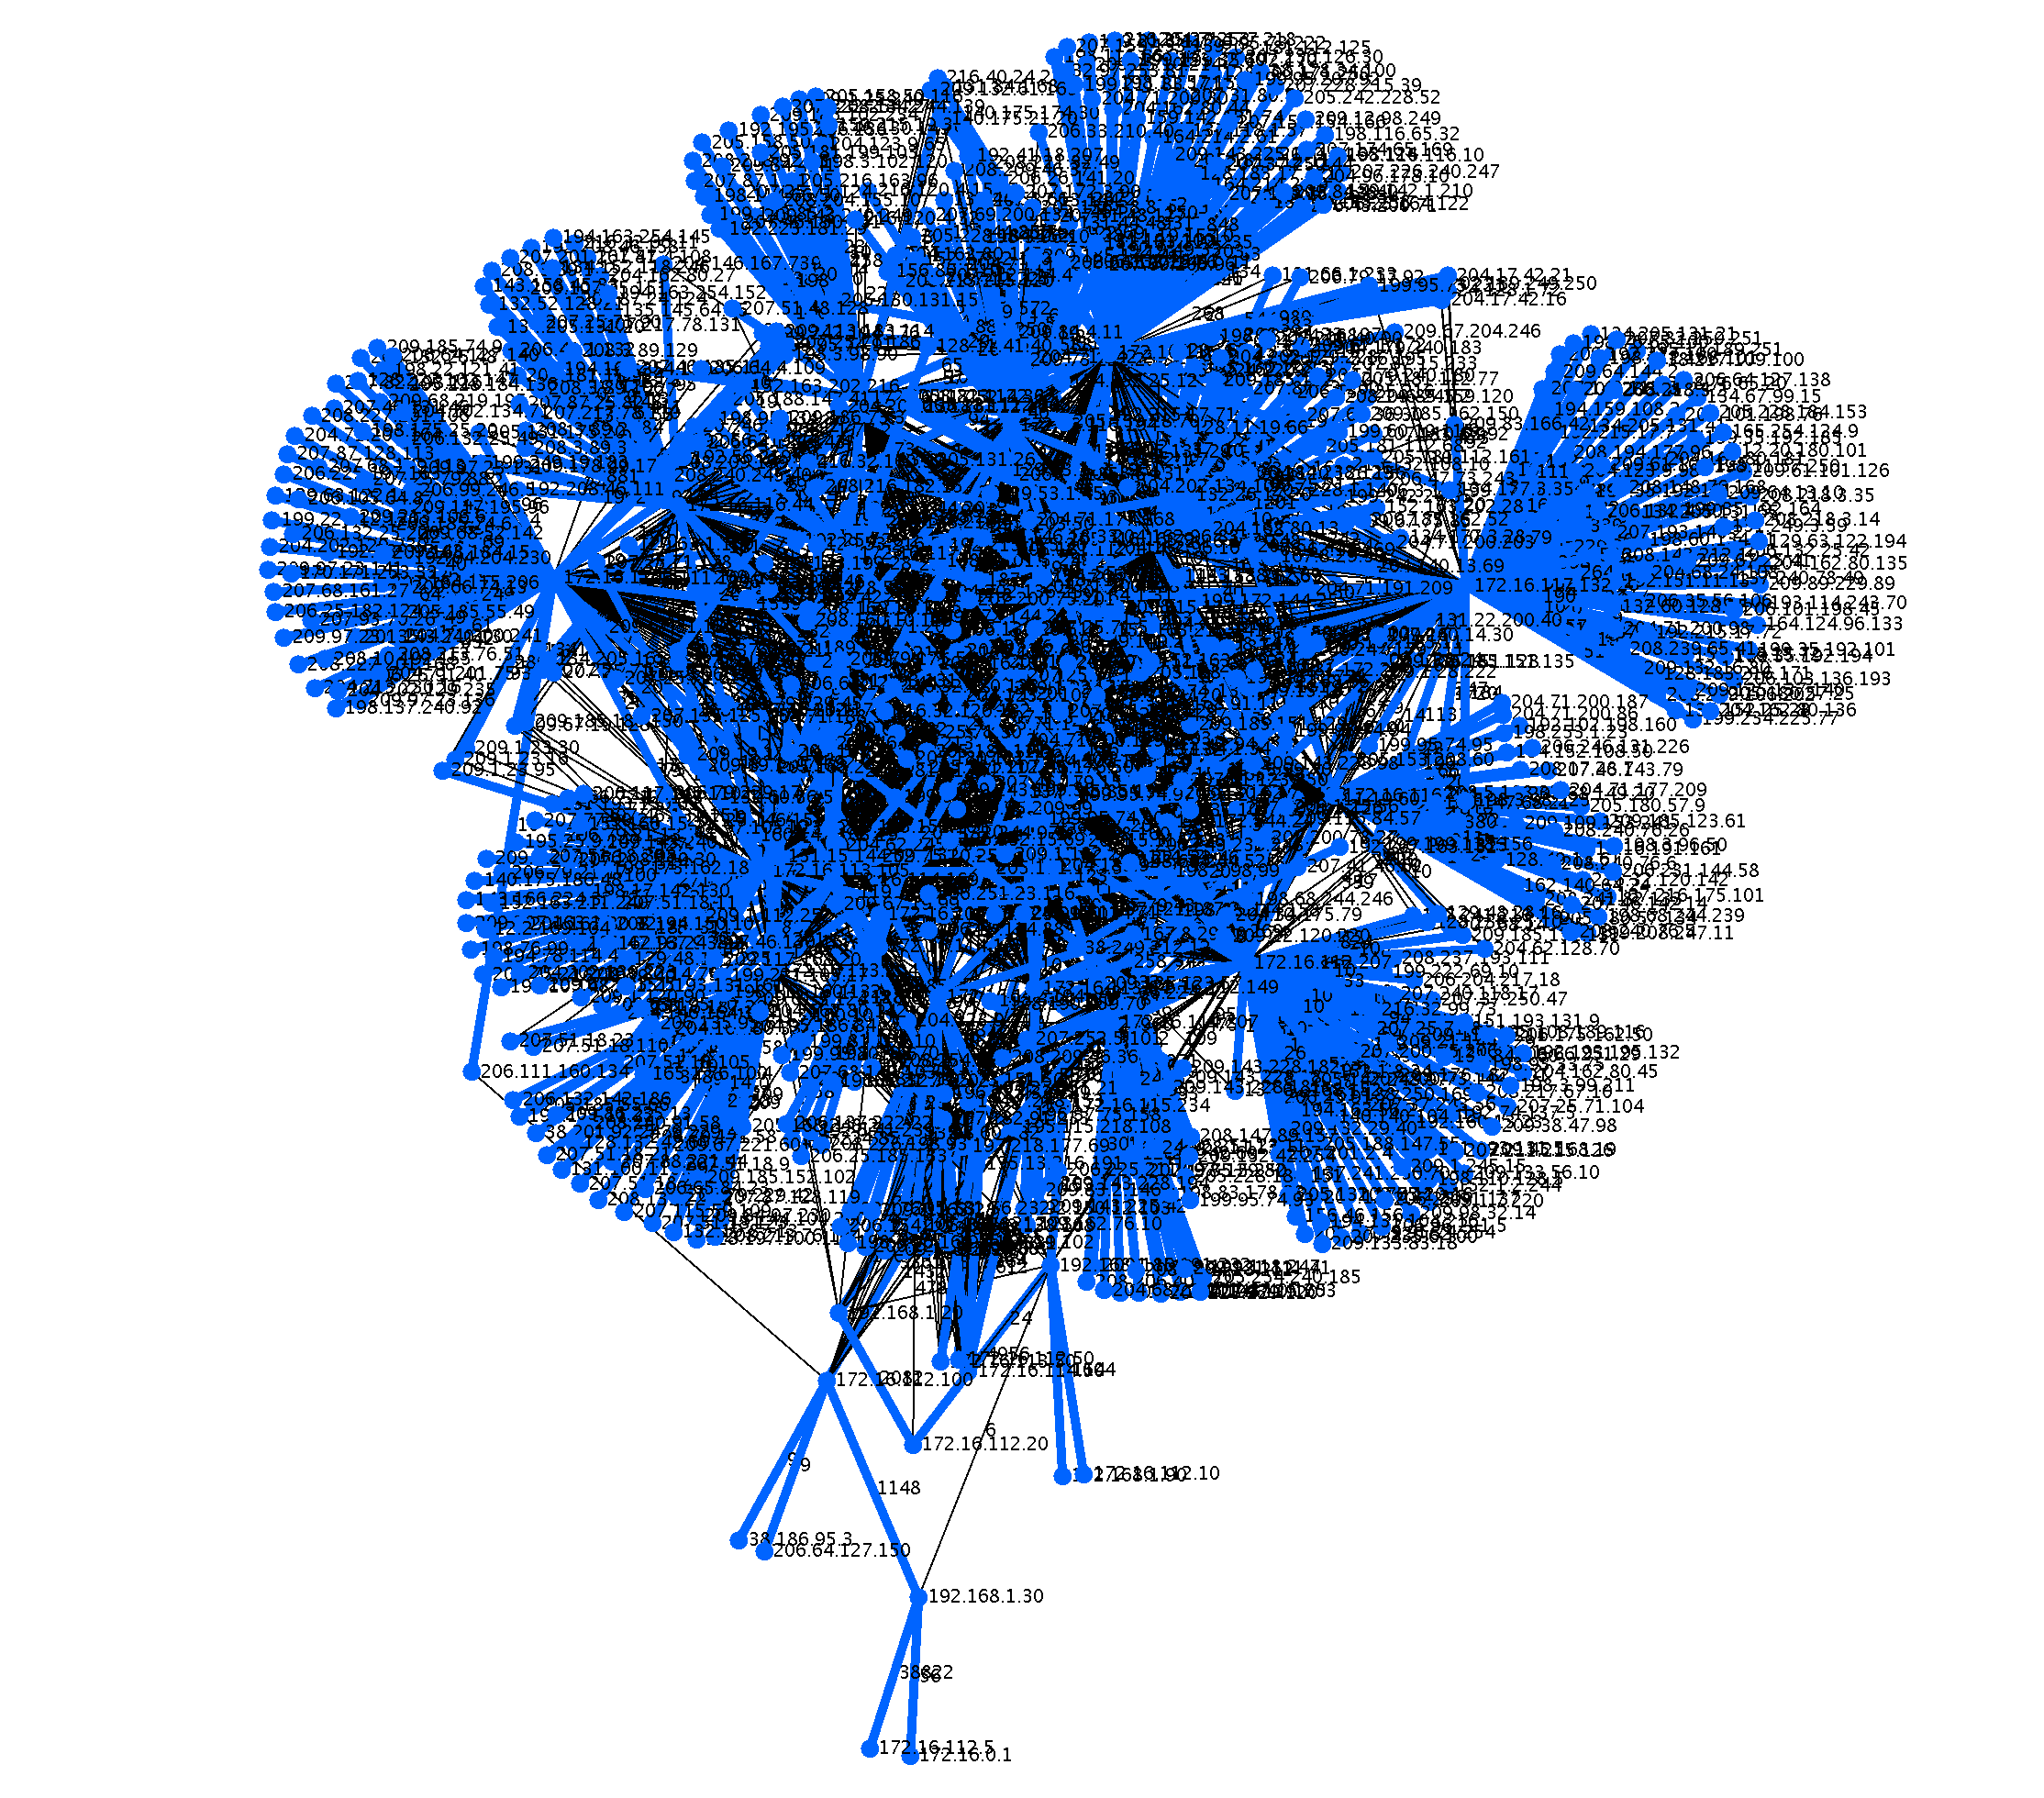
$sh run.sh outside.tcpdump
CC:0, 840 Nodes Total
=Without Maximum Spanning Tree:
  172.16.112.207,174
  172.16.117.132,160
  172.16.113.105,155
=With Maximum Spanning Tree (Weight:969696):
  172.16.112.207,97
  172.16.117.132,91
  172.16.115.87,80
CC:1, 2 Nodes Total
=Without Maximum Spanning Tree:
  192.168.1.2,1
  192.168.1.1,1
=With Maximum Spanning Tree (Weight:264):
  192.168.1.2,1
  192.168.1.1,1
snort.log.1425771020
Output updated because file at URL changed
Here is the output for the file SPARSA Information Security Talent Search snort.log.1425771020.
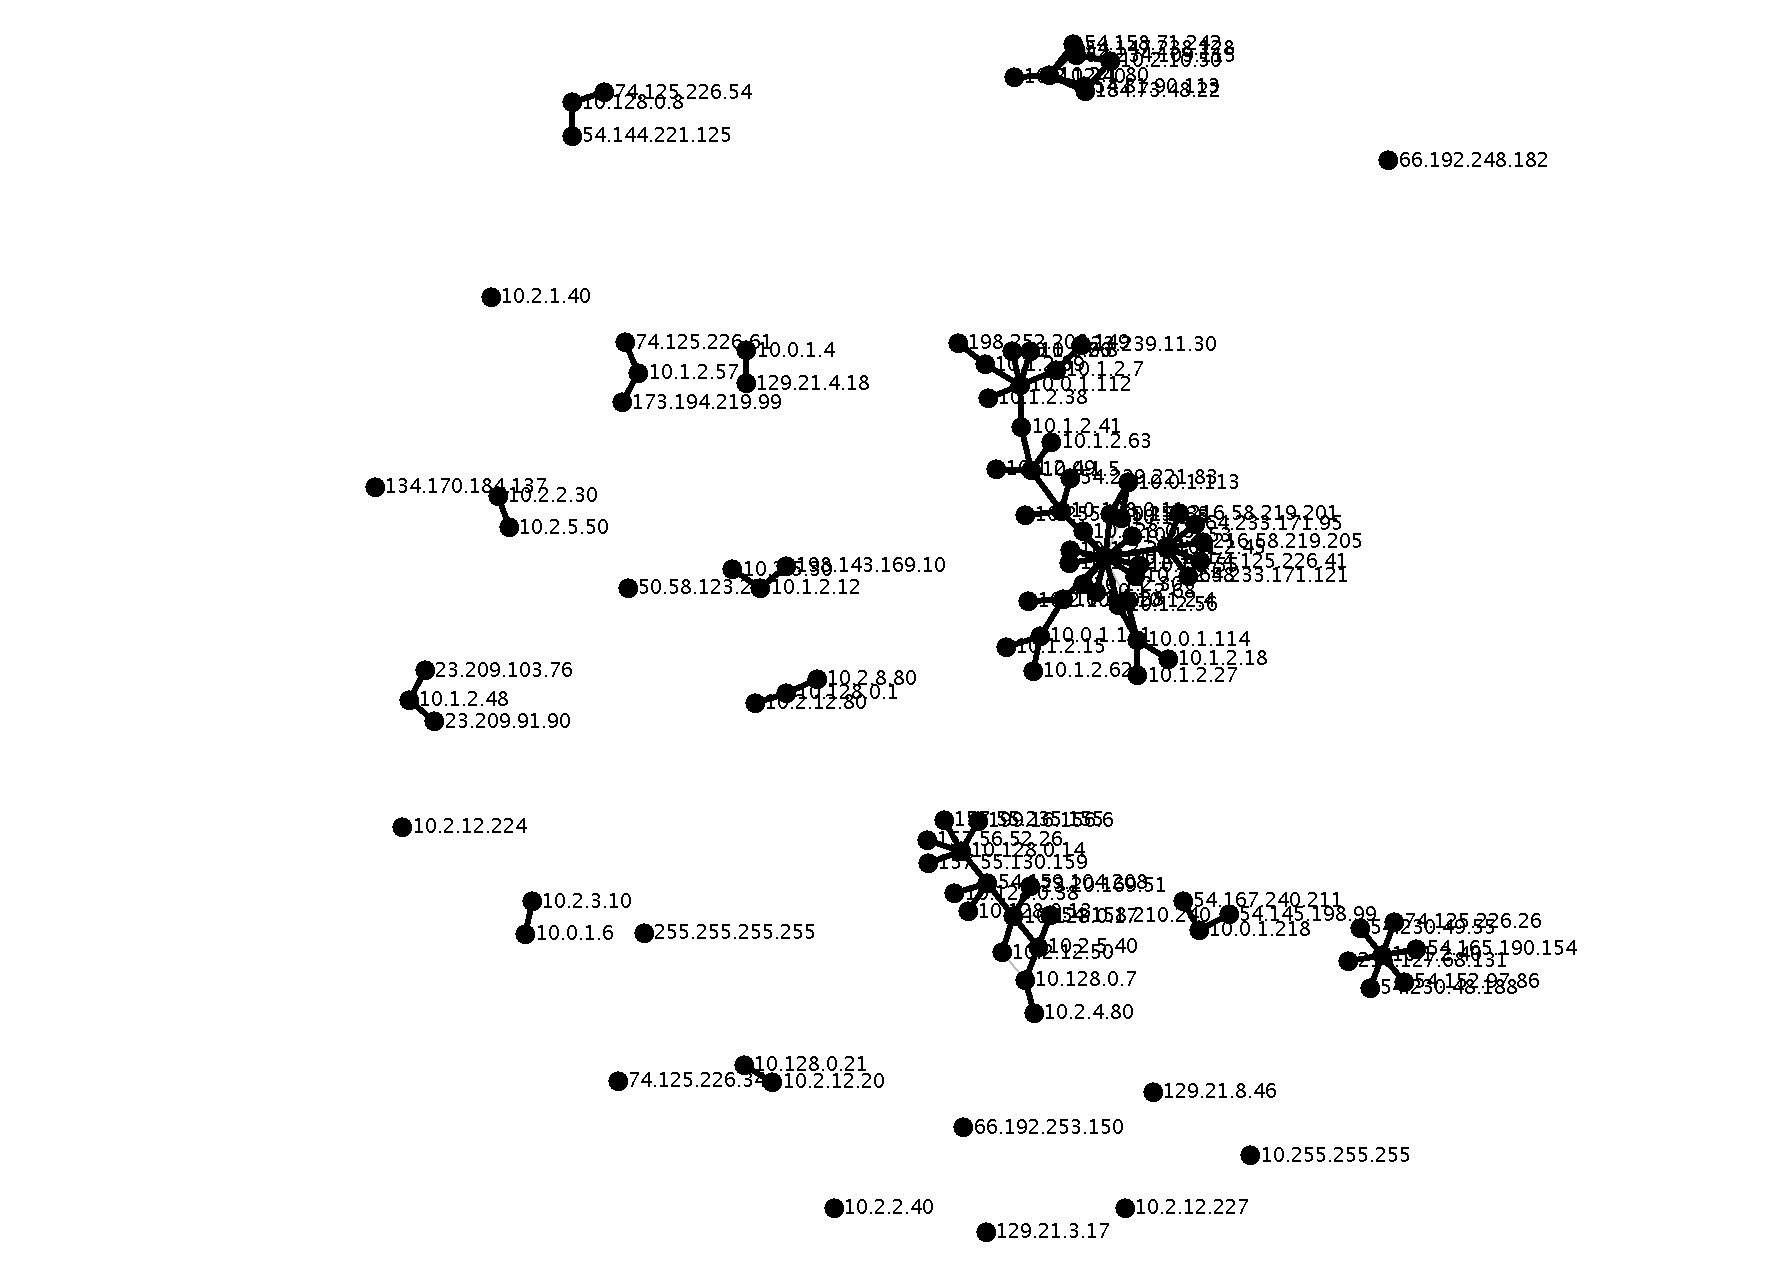
$sh run.sh snort.log.1425771020
CC:0, 87 Nodes Total
=Without Maximum Spanning Tree:
  10.0.1.101,19
  10.0.1.5,10
  10.1.2.45,7
  10.0.1.111,7
  10.0.1.112,6
  10.0.1.4,6
  10.0.1.114,5
  10.1.2.48,5
  10.128.0.8,4
  10.2.3.30,4
=With Maximum Spanning Tree (Weight:124095):
  10.0.1.101,15
  10.0.1.5,7
  10.1.2.45,7
CC:1, 30 Nodes Total
=Without Maximum Spanning Tree:
  10.128.0.14,8
  10.2.1.80,7
  10.128.0.17,7
  10.2.10.50,5
  54.159.104.208,4
  10.128.0.7,4
  10.2.12.50,3
  10.2.5.40,3
  10.128.0.13,3
  184.73.48.22,2
=With Maximum Spanning Tree (Weight:7077):
  10.128.0.14,8
  10.2.1.80,6
  10.128.0.17,6
CC:2, 9 Nodes Total
=Without Maximum Spanning Tree:
  10.1.2.40,8
  54.165.190.154,1
  54.152.97.86,1
  74.125.226.26,1
  54.230.49.55,1
  54.230.48.188,1
  23.78.195.18,1
  216.127.68.131,1
  74.125.226.62,1
=With Maximum Spanning Tree (Weight:28):
  10.1.2.40,8
  54.165.190.154,1
  54.152.97.86,1
CC:3, 5 Nodes Total
=Without Maximum Spanning Tree:
  10.0.1.218,4
  23.21.46.139,1
  54.167.240.211,1
  54.145.198.99,1
  184.73.242.180,1
=With Maximum Spanning Tree (Weight:108):
  10.0.1.218,4
  23.21.46.139,1
  54.167.240.211,1
CC:4, 5 Nodes Total
=Without Maximum Spanning Tree:
  10.128.0.21,4
  10.2.2.50,1
  10.2.12.20,1
  74.125.226.36,1
  4.28.136.36,1
=With Maximum Spanning Tree (Weight:256):
  10.128.0.21,4
  10.2.2.50,1
  10.2.12.20,1
CC:5, 4 Nodes Total
=Without Maximum Spanning Tree:
  10.1.2.57,3
  173.194.219.99,1
  199.59.148.84,1
  74.125.226.61,1
=With Maximum Spanning Tree (Weight:6):
  10.1.2.57,3
  173.194.219.99,1
  199.59.148.84,1
CC:6, 3 Nodes Total
=Without Maximum Spanning Tree:
  10.2.3.10,2
  10.0.1.6,1
  10.2.3.100,1
=With Maximum Spanning Tree (Weight:12):
  10.2.3.10,2
  10.0.1.6,1
  10.2.3.100,1
CC:7, 2 Nodes Total
=Without Maximum Spanning Tree:
  10.2.2.30,1
  10.2.5.50,1
=With Maximum Spanning Tree (Weight:38):
  10.2.2.30,1
  10.2.5.50,1
CC:8, 2 Nodes Total
=Without Maximum Spanning Tree:
  8.8.8.8,1
  10.0.1.31,1
=With Maximum Spanning Tree (Weight:8):
  8.8.8.8,1
  10.0.1.31,1
CC:9, 2 Nodes Total
=Without Maximum Spanning Tree:
  129.21.26.248,1
  10.1.2.32,1
=With Maximum Spanning Tree (Weight:4):
  129.21.26.248,1
  10.1.2.32,1
To Deliver:
Put your code in a folder called ‘project1’ on the UNIX system. Your code should take a PCAP file name as the first command line argument to the run.sh script.
$sh run.sh sometestfile.pcap
Also write a memo.txt discussing the challenges and what you learned on this assignment. Also, answer the following questions:
1. What do the high degree nodes represent when looking at the connected components?
2. What do the high degree nodes represent when looking at the maximum spanning trees of the connected components?
Grading (total 25 points):
Due: 6/23 @5pm.
6 points: Build undirected graph from PCAP data.
7 points: Compute connected components with own implementation of BFS or DFS.
7 points: Compute maximum spanning tree with own implementation of Prim or Kruskal’s algorithm.
5 points: memo.txt and how easy the assignment is to grade