 |
 |
For this project you will be studying the p53 protein between many species and building a graph to visualize the relationship between them. This protein is known to be a tumor suppressor and is discussed here: http://www.uniprot.org/uniprot/P04637
#0
Obtain the FASTA formatted sequences for the p53 protein from at least 20 species. You can find them here: http://www.ncbi.nlm.nih.gov/protein/?term=p53 and here: http://www.bioinformatics.org/p53/protein.html. An example of the FASTA file for Homo sapiens is show below. We can ignore the FASTA header and just use the sequence that follows it.
>gi|4731632|gb|AAD28535.1|AF135121_1 tumor suppressor protein p53 [Homo sapiens]
MEEPQSDPSVEPPLSQETFSDLWKLLPENNVLSPLPSQAMDDLMLSPDDIEQWFTEDPGPDEAPRMPEAA
PRVAPAPAAPTPAAPAPAPSWPLSSSVPSQKTYQGSYGFRLGFLHSGTAKSVTCTYSPALNKMFCQLAKT
CPVQLWVDSTPPPGTRVRAMAIYKQSQHMTEVVRRCPHHERCSDSDGLAPPQHLIRVEGNLRVEYLDDRN
TFRHSVVVPYEPPEVGSDCTTIHYNYMCNSSCMGGMNRRPILTIITLEDSSGNLLGRNSFEVRVCACPGR
DRRTEKENLRKKGEPHHELPPGSTKRALPNNTSSSPQPKKKPLDGEYFTLQIRGRERFEMFRELNEALEL
KDAQAGKEPGGSRAHSSHLKSKKGQSTSRHKKLMFKTEGPDSD
>gi|200203|gb|AAA39883.1| p53 [Mus musculus]
MTAMEESQSDISLELPLSQETFSGLWKLLPPEDILPSPHCMDDLLLPQDVEEFFEGPSEALRVSGAPAAQ
DPVTETPGPVAPAPATPWPLSSFVPSQKTYQGNYGFHLGFLQSGTAKSVMCTYSPPLNKLFFQLAKTCPV
QLWVSATPPAGSRVRAMAIYKKSQHMTEVVRRCPHHERCSDGDGLAPPQHLIRVEGNLYPEYLEDRQTFR
HSVVVPYEPPEAGSEYTTIHYKYMCNSSCMGGMNRRPILTIITLEDSSGNLLGRDSFEVRVCACPGRDRR
TEEENFRKKEVLCPELPPGSAKRALPTCTSASPPQKKKPLDGEYFTLKIRGRKRFEMFRELNEALELKDA
HATEESGDSRAHSSLQPRAFQALIKEESPNC
Because some amino acids can have similar shape and function the match and mismatch scores can vary. One set of substitution costs is known as BLOSUM. There are examples here: ftp://ftp.ncbi.nih.gov/blast/matrices/. Commonly BLOSUM62 is used but your code must work with all of them. You will need to read in this format and use these match/mismatch costs when calculating your edit distance. Your code will take in a filename such as “BLOSUM62” to read and process it. For a gap you will use the cost of aligning a character with the * column. In the BLOSUM62 file below the penalty for aligning an A with a gap is -4.
Note:The values are inverted from how we talked about edit distance. You will need to invert the sign of each value so that you can minimize the edit distance.
#  Matrix made by matblas from blosum62.iij
#  * column uses minimum score
#  BLOSUM Clustered Scoring Matrix in 1/2 Bit Units
#  Blocks Database = /data/blocks_5.0/blocks.dat
#  Cluster Percentage: >= 62
#  Entropy =   0.6979, Expected =  -0.5209
   A  R  N  D  C  Q  E  G  H  I  L  K  M  F  P  S  T  W  Y  V  B  Z  X  *
A  4 -1 -2 -2  0 -1 -1  0 -2 -1 -1 -1 -1 -2 -1  1  0 -3 -2  0 -2 -1  0 -4
R -1  5  0 -2 -3  1  0 -2  0 -3 -2  2 -1 -3 -2 -1 -1 -3 -2 -3 -1  0 -1 -4
N -2  0  6  1 -3  0  0  0  1 -3 -3  0 -2 -3 -2  1  0 -4 -2 -3  3  0 -1 -4
D -2 -2  1  6 -3  0  2 -1 -1 -3 -4 -1 -3 -3 -1  0 -1 -4 -3 -3  4  1 -1 -4
C  0 -3 -3 -3  9 -3 -4 -3 -3 -1 -1 -3 -1 -2 -3 -1 -1 -2 -2 -1 -3 -3 -2 -4
Q -1  1  0  0 -3  5  2 -2  0 -3 -2  1  0 -3 -1  0 -1 -2 -1 -2  0  3 -1 -4
E -1  0  0  2 -4  2  5 -2  0 -3 -3  1 -2 -3 -1  0 -1 -3 -2 -2  1  4 -1 -4
G  0 -2  0 -1 -3 -2 -2  6 -2 -4 -4 -2 -3 -3 -2  0 -2 -2 -3 -3 -1 -2 -1 -4
H -2  0  1 -1 -3  0  0 -2  8 -3 -3 -1 -2 -1 -2 -1 -2 -2  2 -3  0  0 -1 -4
I -1 -3 -3 -3 -1 -3 -3 -4 -3  4  2 -3  1  0 -3 -2 -1 -3 -1  3 -3 -3 -1 -4
L -1 -2 -3 -4 -1 -2 -3 -4 -3  2  4 -2  2  0 -3 -2 -1 -2 -1  1 -4 -3 -1 -4
K -1  2  0 -1 -3  1  1 -2 -1 -3 -2  5 -1 -3 -1  0 -1 -3 -2 -2  0  1 -1 -4
M -1 -1 -2 -3 -1  0 -2 -3 -2  1  2 -1  5  0 -2 -1 -1 -1 -1  1 -3 -1 -1 -4
F -2 -3 -3 -3 -2 -3 -3 -3 -1  0  0 -3  0  6 -4 -2 -2  1  3 -1 -3 -3 -1 -4
P -1 -2 -2 -1 -3 -1 -1 -2 -2 -3 -3 -1 -2 -4  7 -1 -1 -4 -3 -2 -2 -1 -2 -4
S  1 -1  1  0 -1  0  0  0 -1 -2 -2  0 -1 -2 -1  4  1 -3 -2 -2  0  0  0 -4
T  0 -1  0 -1 -1 -1 -1 -2 -2 -1 -1 -1 -1 -2 -1  1  5 -2 -2  0 -1 -1  0 -4
W -3 -3 -4 -4 -2 -2 -3 -2 -2 -3 -2 -3 -1  1 -4 -3 -2 11  2 -3 -4 -3 -2 -4
Y -2 -2 -2 -3 -2 -1 -2 -3  2 -1 -1 -2 -1  3 -3 -2 -2  2  7 -1 -3 -2 -1 -4
V  0 -3 -3 -3 -1 -2 -2 -3 -3  3  1 -2  1 -1 -2 -2  0 -3 -1  4 -3 -2 -1 -4
B -2 -1  3  4 -3  0  1 -1  0 -3 -4  0 -3 -3 -2  0 -1 -4 -3 -3  4  1 -1 -4
Z -1  0  0  1 -3  3  4 -2  0 -3 -3  1 -1 -3 -1  0 -1 -3 -2 -2  1  4 -1 -4
X  0 -1 -1 -1 -2 -1 -1 -1 -1 -1 -1 -1 -1 -1 -2  0  0 -2 -1 -1 -1 -1 -1 -4
* -4 -4 -4 -4 -4 -4 -4 -4 -4 -4 -4 -4 -4 -4 -4 -4 -4 -4 -4 -4 -4 -4 -4  1
#1
Compute the minimum edit distance between each species’ p53 protein. Use the standard Needleman-Wunsch edit distance algorithm. Loop through the >=20 proteins contained in a folder specified. If a cost matrix file is specified then use that file otherwise use a mismatch and gap penalty of both 1.
Print out the alignment scores in a program ProteinCompare.java as follows:
$java ProteinCompare <FOLDER WITH PROTEINS> <OPTIONAL COST MATRIX>
Protein1	Protein1	0
Protein1	Protein2	cost
Protein1	Protein3	cost
Protein2	Protein2	0
..
Here are the alignment scores of the two FASTA files shown in section 0 using the BIOSUM62 cost matrix:
$java ProteinCompare proteinfolder BLOSUM62
Homosapiens.fa Homosapiens.fa -2119
Homosapiens.fa Musmusculus.fa -1455
Musmusculus.fa Homosapiens.fa -1455
Musmusculus.fa Musmusculus.fa -2039

$java ProteinCompare proteinfolder
Homosapiens.fa	Homosapiens.fa	0
Homosapiens.fa	Musmusculus.fa	107
Musmusculus.fa	Homosapiens.fa	107
Musmusculus.fa	Musmusculus.fa	0
#2
Show the minimum alignment between two proteins as shown below. Take the two FASTA files in as input. If a cost matrix file is specified then use that file otherwise use a skip and gap penalty of both 1. This example uses an mismatch cost of 1 and a gap penalty of 2.
$java ShowAlignment p53-AAD28535-homo-sapiens.fa p53-Q95330-rabbit.fa <OPTIONAL COST MATRIX>
Cost of 61
M M  0
E E  0
E E  0
P S  1
Q Q  0
...
T N  1
E E  0
D D  0
P P  0
G E  1
P    2
D    2
E E  0
A G  1
P L  1
R R  0
M V  1
P P  0
E A  1
A A  0
A P  1
P A  1
R P  1
V E  1
A A  0
P P  0
A A  0
P P  0
A A  0
A A  0
P P  0
T A  1
P L  1
A A  0
A A  0
P P  0
A A  0
P P  0
A A  0
P T  1
S S  0
W W  0
P P  0
...
Here are some small examples to make sure your alignment is working correctly. Here I am also printing the cost matrix and the path where the values came from. This is using the BLOSUM62 cost matrix. You won’t print these out though.
EEPQSDPSV
MEEPQSDPSV
Distance:	-43
  0,  4,  8, 12, 16, 20, 24, 28, 32, 36, 40,
  4,  2, -1,  3,  7, 11, 15, 19, 23, 27, 31,
  8,  6, -3, -6, -2,  2,  6, 10, 14, 18, 22,
 12, 10,  1, -2,-13, -9, -5, -1,  3,  7, 11,
 16, 12,  5, -1, -9,-18,-14,-10, -6, -2,  2,
 20, 16,  9,  3, -5,-14,-22,-18,-14,-10, -6,
 24, 20, 13,  7, -1,-10,-18,-28,-24,-20,-16,
 28, 24, 17, 11,  0, -6,-14,-24,-35,-31,-27,
 32, 28, 21, 15,  4, -2,-10,-20,-31,-39,-35,
 36, 31, 25, 19,  8,  2, -6,-16,-27,-35,-43,
  .,  -,  -,  -,  -,  -,  -,  -,  -,  -,  -,
  |,  \,  \,  \,  -,  -,  -,  -,  -,  -,  -,
  |,  \,  \,  \,  -,  -,  -,  -,  -,  -,  -,
  |,  \,  |,  \,  \,  -,  -,  -,  \,  -,  -,
  |,  \,  |,  \,  |,  \,  -,  -,  -,  -,  -,
  |,  |,  |,  |,  |,  |,  \,  -,  -,  \,  -,
  |,  |,  |,  \,  |,  |,  |,  \,  -,  -,  -,
  |,  |,  |,  |,  \,  |,  |,  |,  \,  -,  -,
  |,  |,  |,  |,  |,  |,  \,  |,  |,  \,  -,
  |,  \,  |,  |,  |,  |,  |,  |,  |,  |,  \,
* M  4
E E  -5
E E  -5
P P  -7
Q Q  -5
S S  -4
D D  -6
P P  -7
S S  -4
V V  -4


EEPQSDPSV
MTAMEESQSD
Distance:	4
  0,  4,  8, 12, 16, 20, 24, 28, 32, 36, 40,
  4,  2,  5,  9, 13, 11, 15, 19, 23, 27, 31,
  8,  6,  3,  6, 10,  8,  6, 10, 14, 18, 22,
 12, 10,  7,  4,  8, 11,  9,  7, 11, 15, 19,
 16, 12, 11,  8,  4,  6,  9,  9,  2,  6, 10,
 20, 16, 11, 10,  8,  4,  6,  5,  6, -2,  2,
 24, 20, 15, 13, 12,  6,  2,  6,  5,  2, -8,
 28, 24, 19, 16, 15, 10,  6,  3,  7,  6, -4,
 32, 28, 23, 18, 17, 14, 10,  2,  3,  3,  0,
 36, 31, 27, 22, 17, 18, 14,  6,  4,  5,  4,
  .,  -,  -,  -,  -,  -,  -,  -,  -,  -,  -,
  |,  \,  \,  \,  -,  \,  \,  -,  -,  -,  -,
  |,  \,  \,  \,  -,  \,  \,  -,  -,  -,  -,
  |,  \,  \,  \,  \,  \,  \,  \,  \,  \,  \,
  |,  \,  \,  \,  \,  \,  \,  \,  \,  -,  -,
  |,  |,  \,  \,  |,  \,  \,  \,  |,  \,  -,
  |,  |,  |,  \,  |,  \,  \,  \,  \,  |,  \,
  |,  |,  |,  \,  \,  |,  |,  \,  \,  \,  |,
  |,  |,  \,  \,  \,  |,  \,  \,  \,  \,  |,
  |,  \,  |,  |,  \,  |,  |,  |,  \,  \,  |,
* M  4
* T  4
* A  4
* M  4
E E  -5
E E  -5
P S  1
Q Q  -5
S S  -4
D D  -6
P *  4
S *  4
V *  4


TAMEESQSD
MEEPQSDPSV
Distance:	-9
  0,  4,  8, 12, 16, 20, 24, 28, 32, 36, 40,
  4,  1,  5,  9, 13, 17, 19, 23, 27, 31, 35,
  8,  5,  2,  6, 10, 14, 16, 20, 24, 26, 30,
 12,  3,  6,  4,  8, 10, 14, 18, 22, 25, 25,
 16,  7, -2,  1,  5,  6, 10, 12, 16, 20, 24,
 20, 11,  2, -7, -3,  1,  5,  8, 12, 16, 20,
 24, 15,  6, -3, -6, -3, -3,  1,  5,  8, 12,
 28, 19, 10,  1, -2,-11, -7, -3,  1,  5,  9,
 32, 23, 14,  5,  2, -7,-15,-11, -7, -3,  1,
 36, 27, 18,  9,  6, -3,-11,-21,-17,-13, -9,
  .,  -,  -,  -,  -,  -,  -,  -,  -,  -,  -,
  |,  \,  \,  \,  \,  \,  \,  -,  -,  \,  -,
  |,  \,  \,  \,  \,  \,  \,  -,  \,  \,  -,
  |,  \,  |,  \,  \,  \,  -,  -,  \,  \,  \,
  |,  |,  \,  \,  \,  \,  \,  \,  -,  -,  -,
  |,  |,  \,  \,  -,  -,  -,  \,  -,  \,  -,
  |,  |,  |,  |,  \,  \,  \,  -,  -,  \,  -,
  |,  |,  |,  |,  \,  \,  -,  \,  -,  \,  -,
  |,  |,  |,  |,  \,  |,  \,  -,  -,  \,  -,
  |,  |,  |,  |,  \,  |,  |,  \,  -,  -,  -,
T *  4
A *  4
M M  -5
E E  -5
E E  -5
S P  1
Q Q  -5
S S  -4
D D  -6
* P  4
* S  4
* V  4


TAMEESQSD
MTAMEESQSD
Distance:	-39
  0,  4,  8, 12, 16, 20, 24, 28, 32, 36, 40,
  4,  1, -1,  3,  7, 11, 15, 19, 23, 27, 31,
  8,  5,  1, -5, -1,  3,  7, 11, 15, 19, 23,
 12,  3,  5, -1,-10, -6, -2,  2,  6, 10, 14,
 16,  7,  4,  3, -6,-15,-11, -7, -3,  1,  5,
 20, 11,  8,  5, -2,-11,-20,-16,-12, -8, -4,
 24, 15, 10,  7,  2, -7,-16,-24,-20,-16,-12,
 28, 19, 14, 11,  6, -3,-12,-20,-29,-25,-21,
 32, 23, 18, 13, 10,  1, -8,-16,-25,-33,-29,
 36, 27, 22, 17, 14,  5, -4,-12,-21,-29,-39,
  .,  -,  -,  -,  -,  -,  -,  -,  -,  -,  -,
  |,  \,  \,  -,  -,  -,  -,  -,  -,  -,  -,
  |,  \,  \,  \,  -,  -,  -,  -,  -,  -,  -,
  |,  \,  |,  |,  \,  -,  -,  -,  -,  -,  -,
  |,  |,  \,  |,  |,  \,  \,  -,  -,  -,  -,
  |,  |,  \,  \,  |,  \,  \,  -,  -,  -,  -,
  |,  |,  \,  \,  |,  |,  |,  \,  -,  \,  -,
  |,  |,  |,  \,  |,  |,  |,  |,  \,  -,  -,
  |,  |,  \,  \,  |,  |,  |,  \,  |,  \,  -,
  |,  |,  |,  |,  |,  |,  |,  |,  |,  |,  \,
* M  4
T T  -5
A A  -4
M M  -5
E E  -5
E E  -5
S S  -4
Q Q  -5
S S  -4
D D  -6
#3
We are limited to comparing proteins because comparing the toplevel DNA sequences would take too much memory. Implement the Hirschberg sequence alignment algorithm which only requires O(n+m) space. You do not need to trace back the alignment. You only need to calculate the edit distance. It will output the same results as ProteinCompare.
$java ProteinCompareHirschberg <FOLDER WITH PROTEINS> <OPTIONAL COST MATRIX>
...
#4
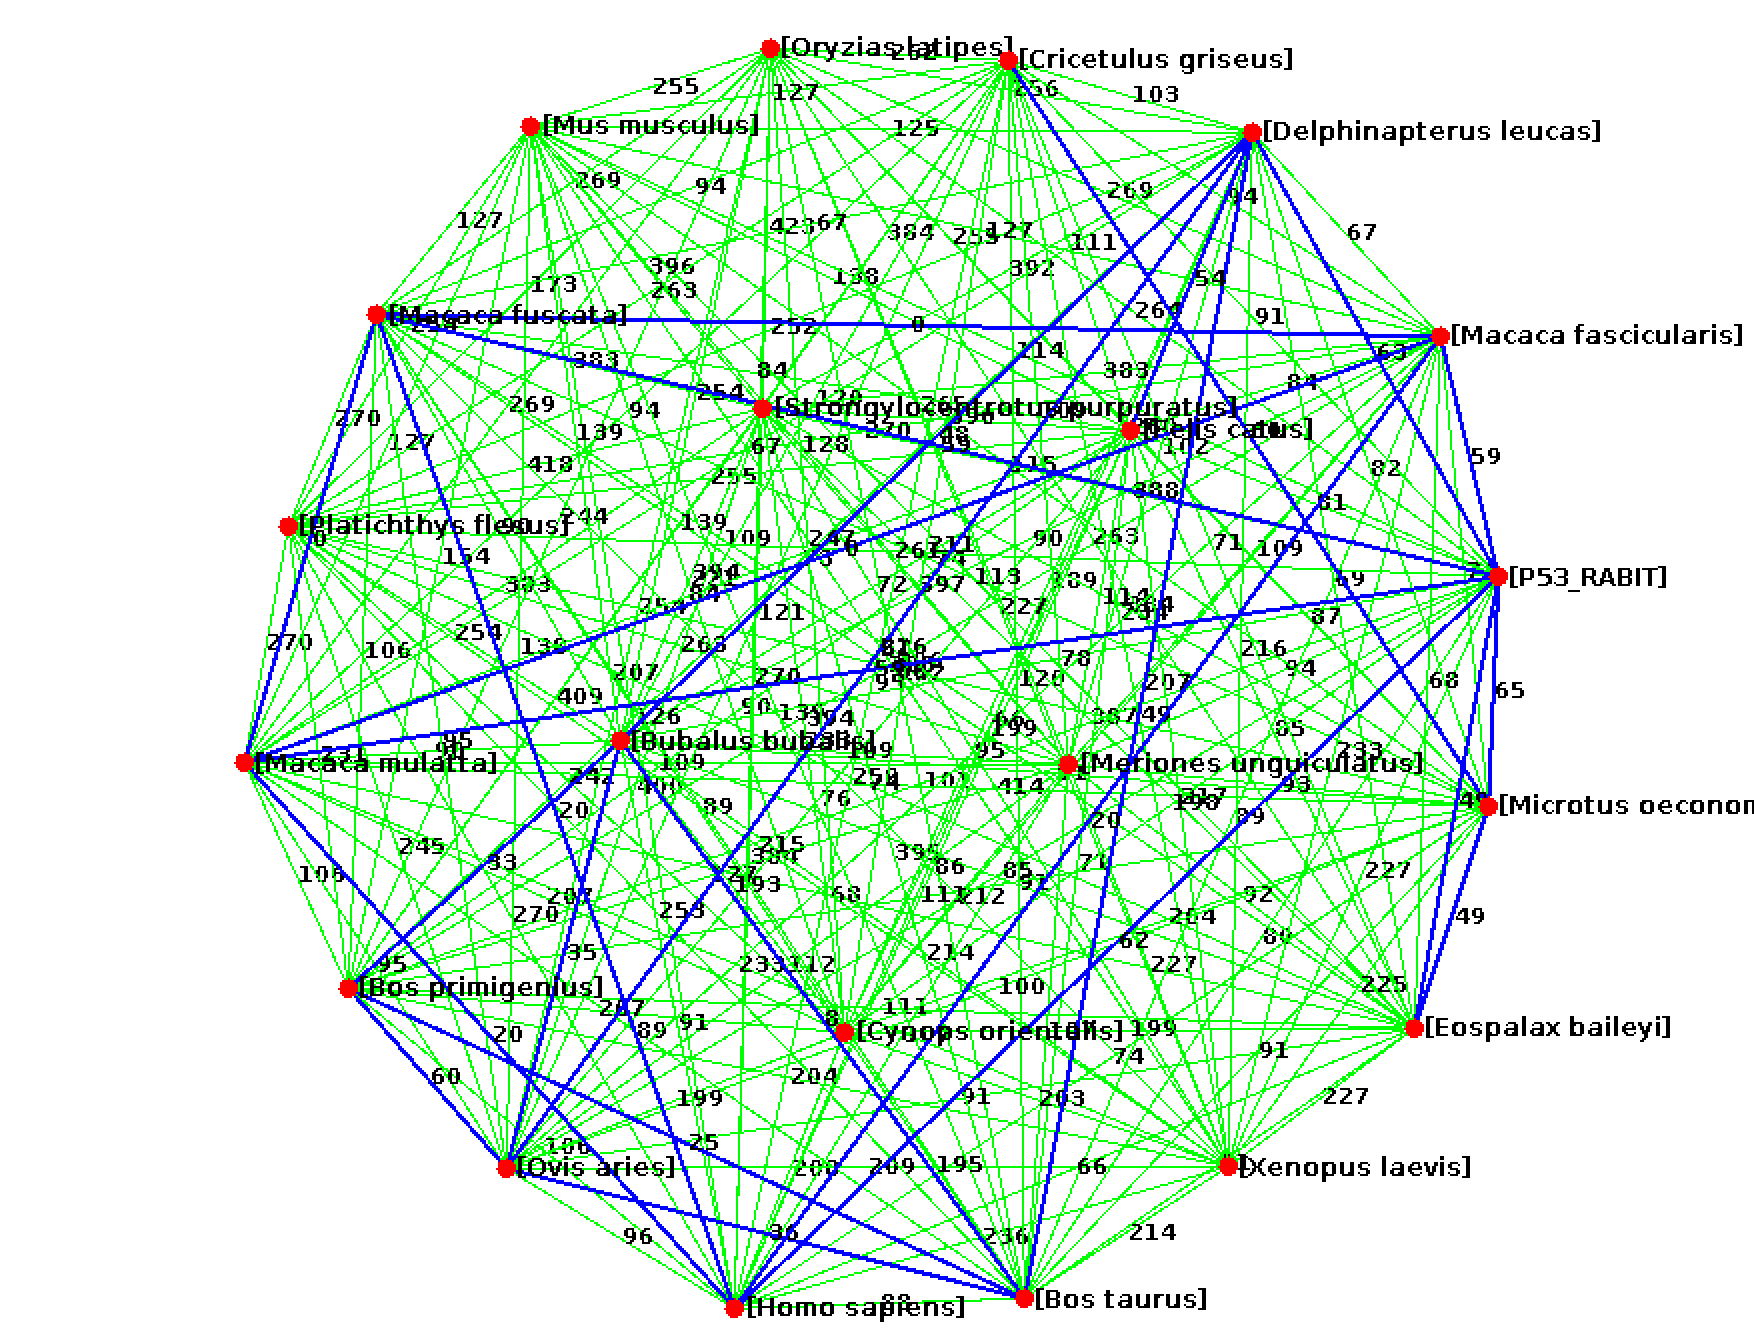
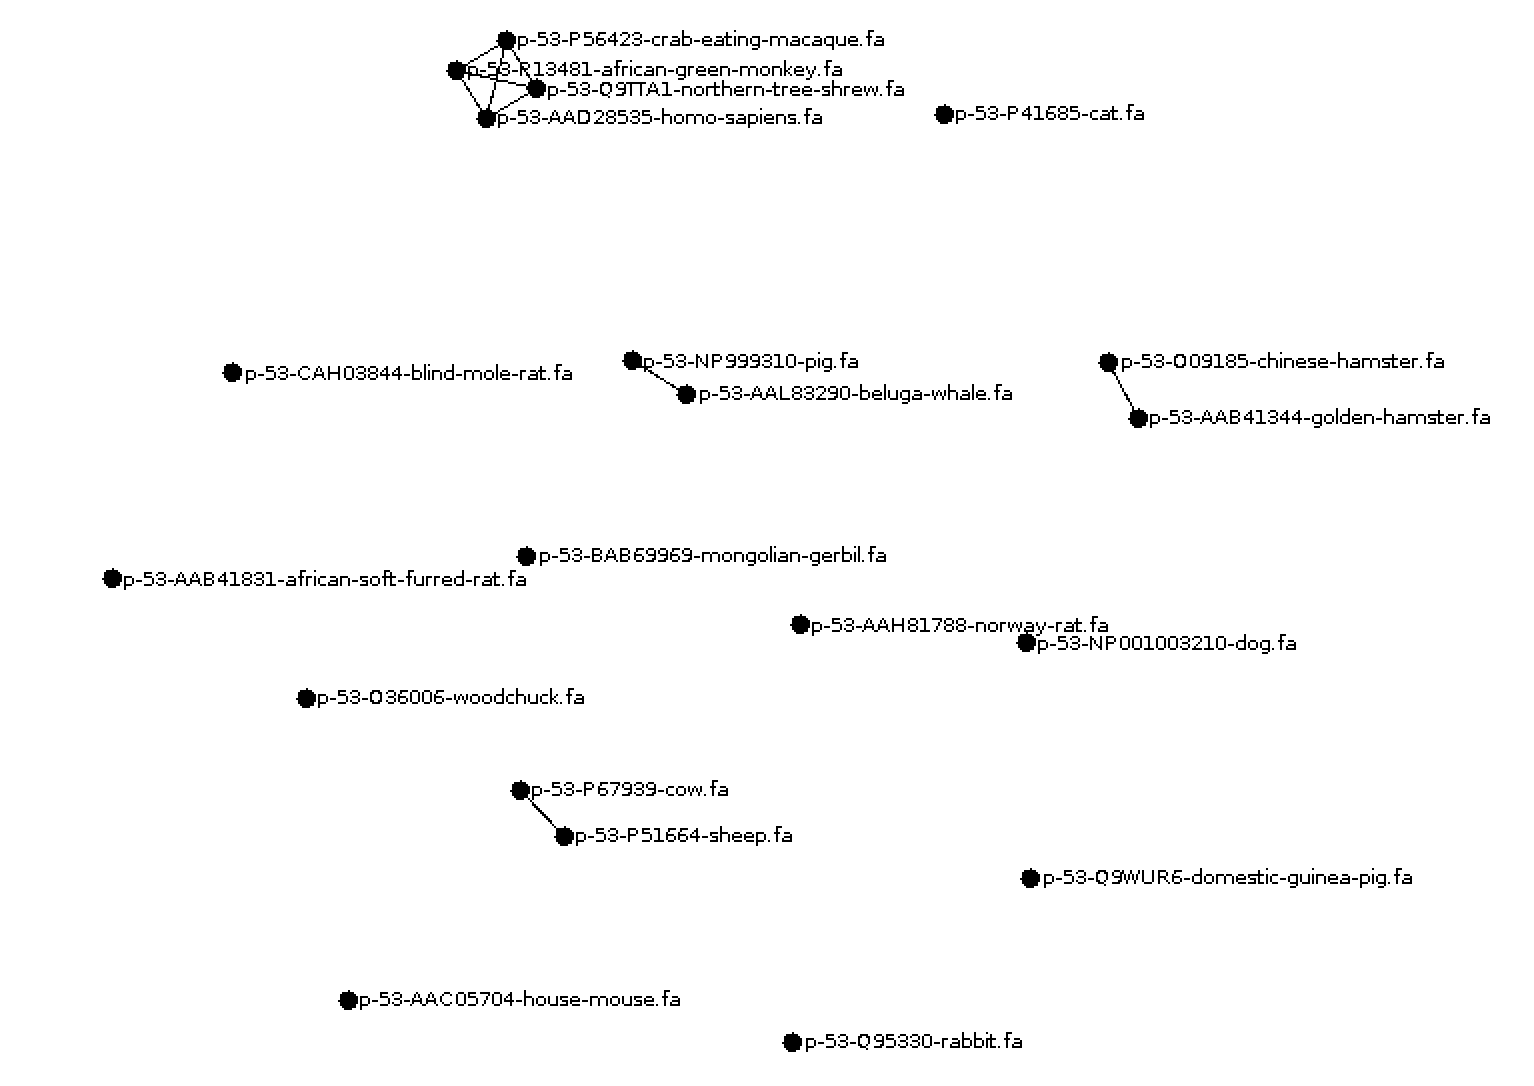
Write a program Visualize.java to visualize the edit distances between proteins using the GraphStream library. Have every species be a node and add an edge between nodes at some threshold of similarity (maybe the mean minimum edit distance). Be sure to have the species name or file name visible for each node.
Here are some GraphStream methods you may need.
edge.setAttribute("layout.weight", 30); // set the visible length of the edge
edge.setAttribute("ui.label", "Label of edge"); // set the text to print on the edge
node.setAttribute("ui.label", "Label of node");
Your code will run like this:
$java Visualize <FOLDER WITH PROTEINS> <OPTIONAL COST MATRIX>
...
Deliverables.
Submit your code (ProteinCompare.java, ShowAlignment.java, Visualize.java). In a memo.txt file discuss how varying the gap and mismatch penalty impacts the alignments. Also discuss what relationships you observed in the similarity graph.
Visualize should run as follows using the compile.sh, run.sh, and getclasspath.sh scripts from project 1. You need to include the jars you use in the lib folder and also modify run.sh to call Visualize
$sh compile.sh # compiles files in src into classes folder
$sh run.sh # sets the classpath to classes and all the jars in lib then calls Visualize
Grading (total 25 points):
Due: 7/28 @11:59pm.
6 points: Part 1: ProteinCompare
6 points: Part 2: ShowAlignment
6 points: Part 3: Visualize
6 points: Part 4: ProteinCompareHirschberg
1 points: memo.txt and how easy the assignment is to grade