Many researchers working on attribute subset selection focus on finding the most discriminating subset suboptimal solution using various methods such as greedy search, best first, genetic algorithms, feature filtering, feature clustering, boosting, markov blankets, mutual information, entropy, and many more. One problem with judging the approach of these algorithms is whether they are appropriate for the problem space. Here I attempt to visualize the 2^n space in order to gain a deeper understanding of the methods that will work.
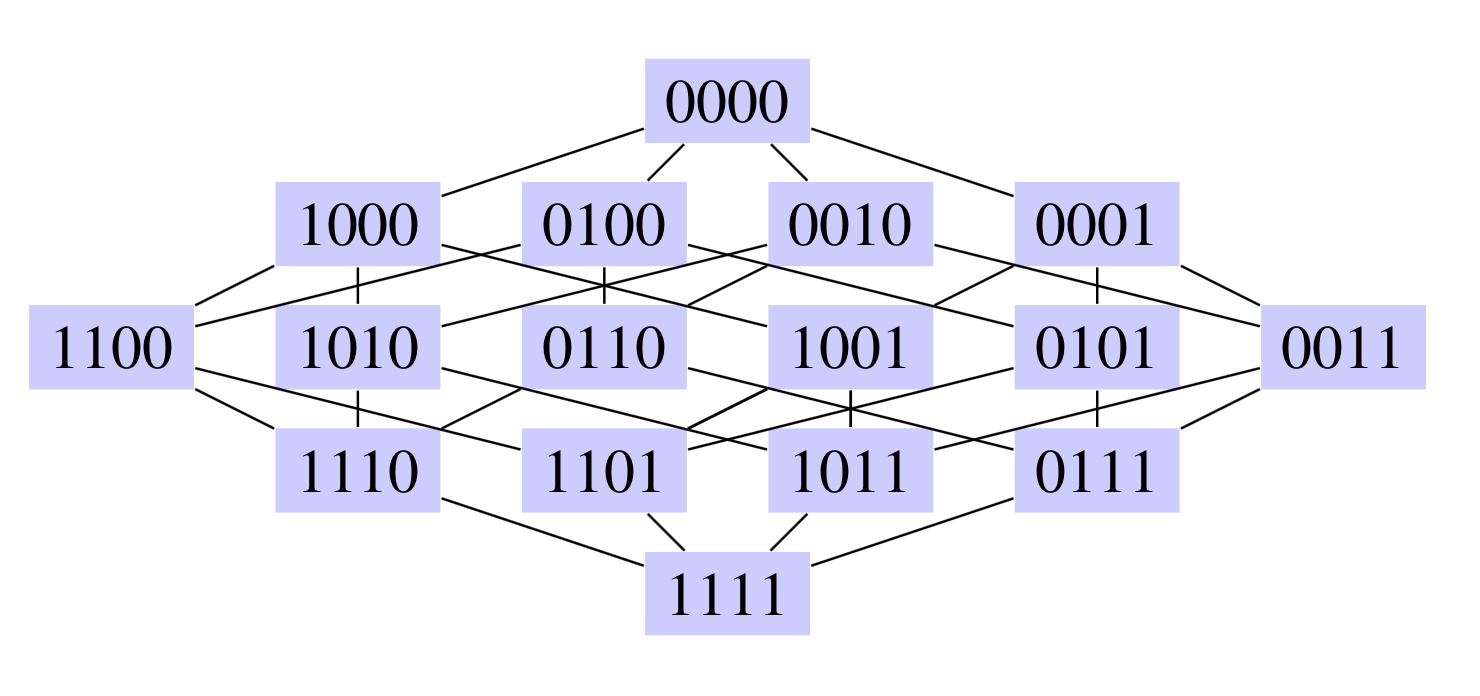
Below is a Kohavi diagram representing the wrapper subset search space for 4 features. 1111 contains all features, 0000 contains no features, and each line represents the addition or removal of a feature.
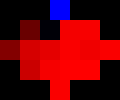
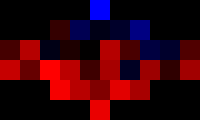
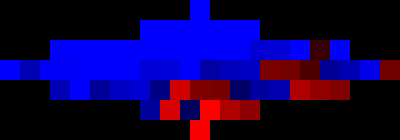
The diagrams below shows the complete wrapper search spaces for various datasets from UCI. Each point represents accuracy of that subset represented by the F1-Score of 5 fold cross validation. Per Kohavi, the cross validation is repeated until the standard deviation is below 1% or a max of 5 times. The mean is what is shown. The classifier used is Naive Bayes.
The colors represent the F1-Score and are scaled to show more contrast. Blue represents the minimum value to the mean and red represents the mean to the max value. The code is here:
oval = rows[x].get(y);
soval = (oval-min)/(max-min);
val = max(0,(int) (soval*255.0*2))-255;
r = max(min(255,val),0);
g = 0;
b = max(min(255,-1*val),0);
File: http://repository.seasr.org/Datasets/UCI/arff/iris.arff
Features: 4
File: http://repository.seasr.org/Datasets/UCI/arff/tae.arff
Features: 5
File: http://repository.seasr.org/Datasets/UCI/arff/car.arff
Features: 6
File: http://repository.seasr.org/Datasets/UCI/arff/ecoli.arff
Features: 7
F1-Score
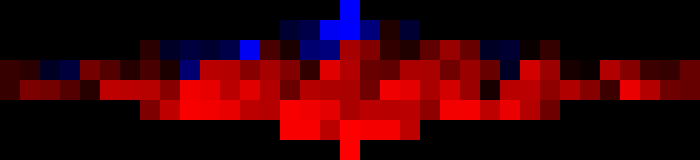
File: http://repository.seasr.org/Datasets/UCI/arff/diabetes.arff
Features: 8
F1-Score
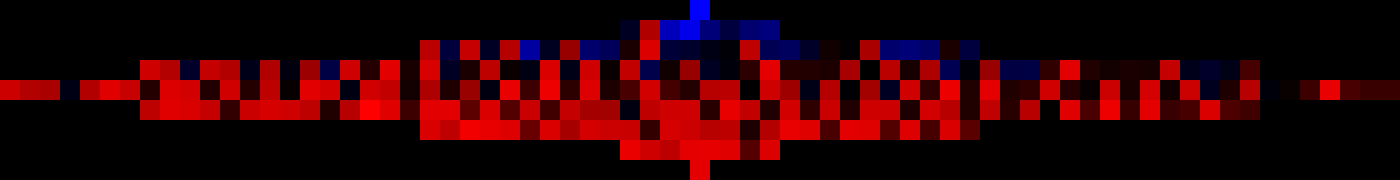
File: http://repository.seasr.org/Datasets/UCI/arff/bridges_version1.arff
Features: 10
F1-Score

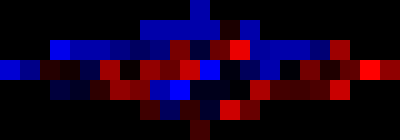
The most interesting dataset was the monks-2.train dataset because between two different classifiers it doesn’t appear to have many of the same optimal subsets. Also it doesn’t appear to have paths of high scoring from 11.1 to a better subset. For the NaiveBayes Classifier the scores were min/max=0.459/0.558. For the J48 the scores were min/max=0.476/0.574
File: https://ml-dolev-amit.googlecode.com/svn/trunk/weka/optional_datasets/monks-2.train.arff
Features: 10
F1-Score
|

|
|
|
|